
| doi:10.3850/978-981-08-6218-3_FRP-Fr015 |
 Final Paper PDF Final Paper PDF
|
AE SIGNAL PROCESSING STUDY BASED ON HHT FOR GFRP
Li Weia, Dai Guangd, Jiang Pengc and Wang Yanrud
Mechanical Science and Engineering College, Daqing Petroleum Institute, Daqing, Heilongjiang Province.
aliweidqpi@163.com
bGdai126@126.com
csvca_0@163.com
dtxy@dqpi.edu.cn
EXTENDED ABSTRACT
Basic principles of Hilbert-Huang transformation is introduced in the paper, also the theoretical basis, based on which Hilbert-Huang transformation can be applied to analyze acoustic emission signal of fiber reinforced plastics acquired during tensile tests, is expatiated briefly. After that, through several practical signal processing examples, it is distinguished time-frequency features of AE signals at different damage. The results show that HHT can effectively retain inherent characteristics of signal sources, and its performance is more excellent in self-adaptive and time-frequency segregation than other time-frequency analysis methods. Also, well localized effect and visual results can be obtained.
1. INTRODUCTION
In this paper, HHT is used to study acoustic emission signals features of GFRP in tensile failure process. After removing noises, different damage stages can be effectively distinguished. This provides a new way for the damage information extraction of GFRP.
The sample used by the test is GFRP. The drawing mill is universal testing machine. In order to remove the noise interference, we can carry out noise-suppressed processing on experiment signal firstly by means of db12 wavelet base.
2. TEST SIGNAL ANALYSIS
2.1. Matrix cracking stage
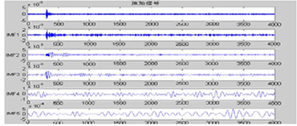
Eight IMF are obtained from EMD classification of original signal, select five IMF components (as shown in Figure 1) from high frequency bands. It can be seen clearly in Figure 2 that the high frequency component of the signal distributes mostly nearby 200 KHz. This shows that, a mass of through cracks have formed, and a series of high frequency signals have been generated. But meanwhile since micro crack keeps expanding in the matrix and interface layer, the signals also include lots of low frequency components, and the frequency domain of the high frequency components and the low frequency components almost are the same.
2.2. Fiber - matrix separation stage
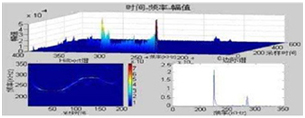
The Hilbert-Huang transformation of the IMF components is shown in Figure 3; There are two stages in the Fiber-Matrix interface separation process, one is interface degumming separation stage, and the other one is fiber breaking stage. The Figure 3 shows that the frequency in the interface degumming separation stage is relatively lower. While the frequency in the fiber fracture stage is relatively higher.
2.3. Fiber fracture separation stage
It can be seen in the three-dimensional spectrum, two-dimensional Hilbert spectrum and marginal spectrum that the signal frequency increment lies mostly between 330 kHz and 350 kHz, and accompanied many high amplitude components. This is due to that the tensile load is mainly resisted by fiber bundles in the fiber fracture stage. When the load increases to 80% of the maximum failure load, fiber bundles break immediately, so the signal frequency is higher.
3. CONCLUSION
From acoustic emission signal analysis with HHT for FRP failure process, it can be seen that, first, FRP failure process is mainly divided into matrix cracking stage, fiber-Matrix interface separation layer stage, fiber fracture stage, and so on. And acoustic emission signals in each stage have different frequency features. Second, Hilbert spectrum and marginal spectrum show that HHT can overcome the limitation of traditional time frequency analysis, and accurately obtain the instant physical quantities of the signals, which helps to obtain the complete and accurate time frequency distribution of the signals.
4. FIGURES
 |
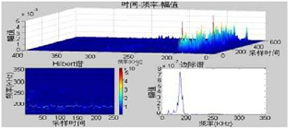 |
Figure 1: EMD decomposition of acoustic emission signal during the matrix cracking stage |
Figure 2: Hilbert spectrum and marginal spectrum of acoustic emission signals during the matrix cracking stage |
 |
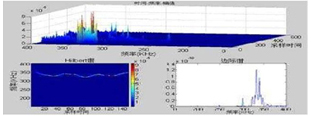 |
Figure 3: Hilbert spectrum and marginal spectrum of acoustic emission signals during Fiber - matrix separation stage |
Figure 4: Hilbert spectrum and marginal spectrum of acoustic emission signal during fiber breakage stage |