
| doi:10.3850/978-981-08-6218-3_CC-We037 |
 Final Paper PDF Final Paper PDF
|
A PARAMETRIC STUDY OF SHEAR CONNECTORS IN STEEL AND CONCRETE COMPOSITE GIRDERS
J. C. Vianna1,a, S. A. L. Andrade1,2,b, P. C. G. S. Vellasco2,c and L. F. C. Neves3
1Civil Engineering Department, Pontifical Catholic University of Rio de Janeiro, Rio de Janeiro, Brazil.
ajcvianna@esp.puc-rio.br
2Structural Engineering Department, State University of Rio de Janeiro, Rio de Janeiro, Brazil.
bandrade@puc-rio.br
cvellasco@eng.uerj.br
3ISISE-Civil Engineering Department, University of Coimbra, Coimbra, Portugal.
luis@dec.uc.pt
EXTENDED ABSTRACT
This paper presents a numerical investigation focused on the evaluation of the structural performance of shear connectors that are commonly used in composite beams. A non-linear numerical finite element modelling was conducted on the Ansys program and was centred on the use of Perfobond, T-Perfobond and stud shear connectors.
This paper uses, in the performed numerical analysis, the results from push-out tests performed at the Civil Engineering Department of the University of Coimbra on different types of connectors: the Perfobond, and an innovative connector: the T-Perfobond, formed by a half of an IPN 340 section with holes in the web (Figure 1). The main difference between the studied Perfobond and T-Perfobond connectors is the presence of a flange, that provides a further anchorage to the system. Both Perfobond and T-Perfobond connectors were fabricated with two holes in the direction of load transfer, for slabs with 120 mm thickness. The Stud shear connector push-out tests were based on Chapman and Balakrishnan results. At this point it is important to stress that the shear connector stiffness and ultimate strength used in the numerical modelling were based on actual experimental evidence.
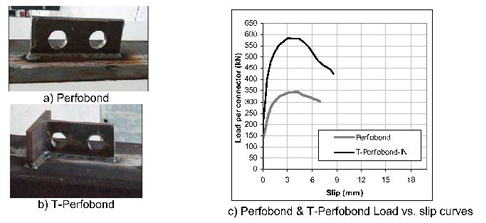
Figure 1: Shear connectors and Perfobond & T-Perfobond Load vs. slip curves
Table 1 presents the model geometric and material characteristics and well as their respective ultimate loads corresponding to the concrete failure.
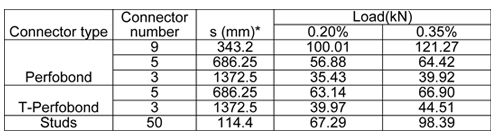
Table 1: Tests configurations and results. (∗ s - spacing)
From all the studied configurations the largest initial stiffness was associated to the Perfobond with nine connectors, simulating a full composite interaction. The other configurations with 5 and 3 Perfobond connectors were used to represent the partial interaction design.
The results also indicate that the Perfobond and the T-Perfobond connectors presented similar ultimate loads and structural responses, although their associated push-out test curves were very distinctive. A possible explanation for the similar structural behaviour of these two different connectors can be related to the fact that in the composite beams the bending prevails instead of the push-out tests direct shear.
Another reason for this trend can be interpreted from the fact that in all the simulations the concrete rupture was directly responsible for the failure, inhibiting the shear connector to reach their ultimate capacities. Figure 2 present the composite slab total strain distribution for the one example of the various investigated models close to the ultimate loading stage.
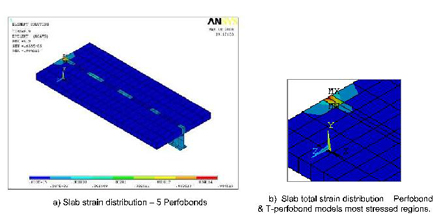
Figure 2: Slab strain distribution
The proposed three-dimensional model provides the opportunity to develop insights that would be virtually impossible using experimental tests, due to costs and, especially, the dispersion of material properties that inevitably occurs in laboratory work. The advantage of Perfobond and T-Perfobond connectors in closely linked to their fatigue behaviour, since their detailing is much more convenient than the stud detailing, leading therefore to advantages in their use for structures subjected traffic or seismic loads.